

I’m getting started with eBPF programming with Aya. The idea behind this series of articles is to learn about a new type of eBPF program and experiment with it using the Rust Aya framework.
Today, we’re going to dive into uProbes and uRetProbes: eBPF programs that probe user space functions without leaving a trace.
You’ll see that this can be very useful for profiling, debugging, or even reverse engineering.
What is a u•Ret•Probe?#
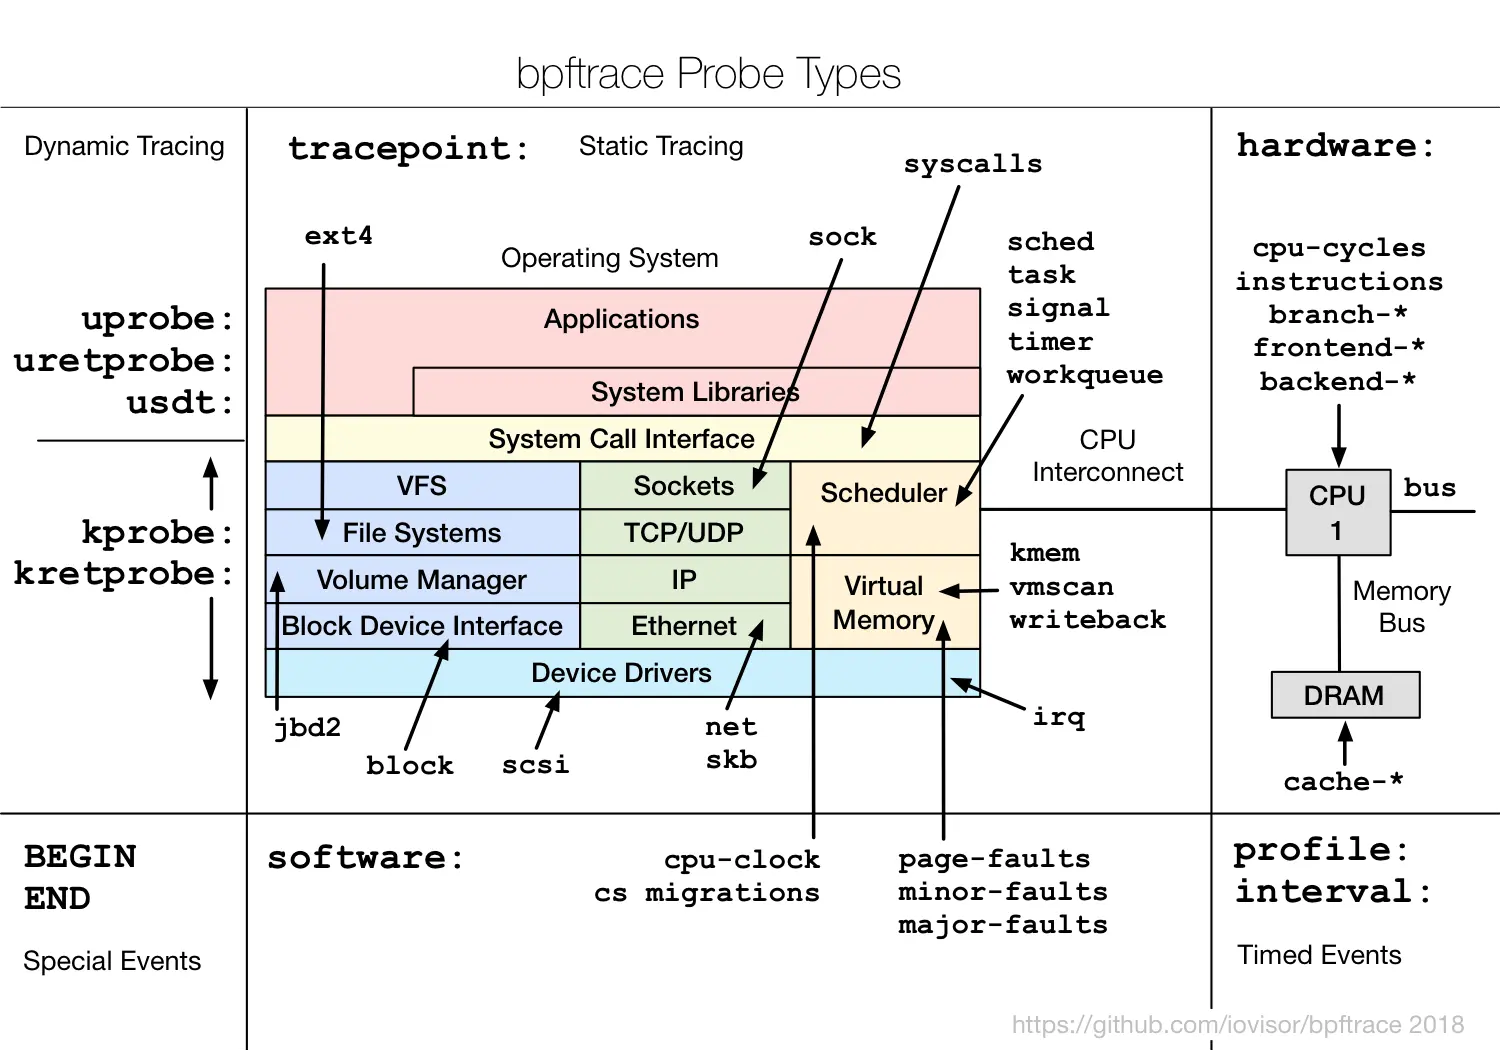
In English, a probe can be defined as a device used to examine or explore something. In eBPF, there are several types: kProbe, kRetProbe, uProbe, uRetProbe, and USDT.
kProbe: the probe for the kernel#
If you consult the eBPF documentation, there is no section dedicated to uProbe or uRetProbe type programs. But there is one dedicated to kProbe:
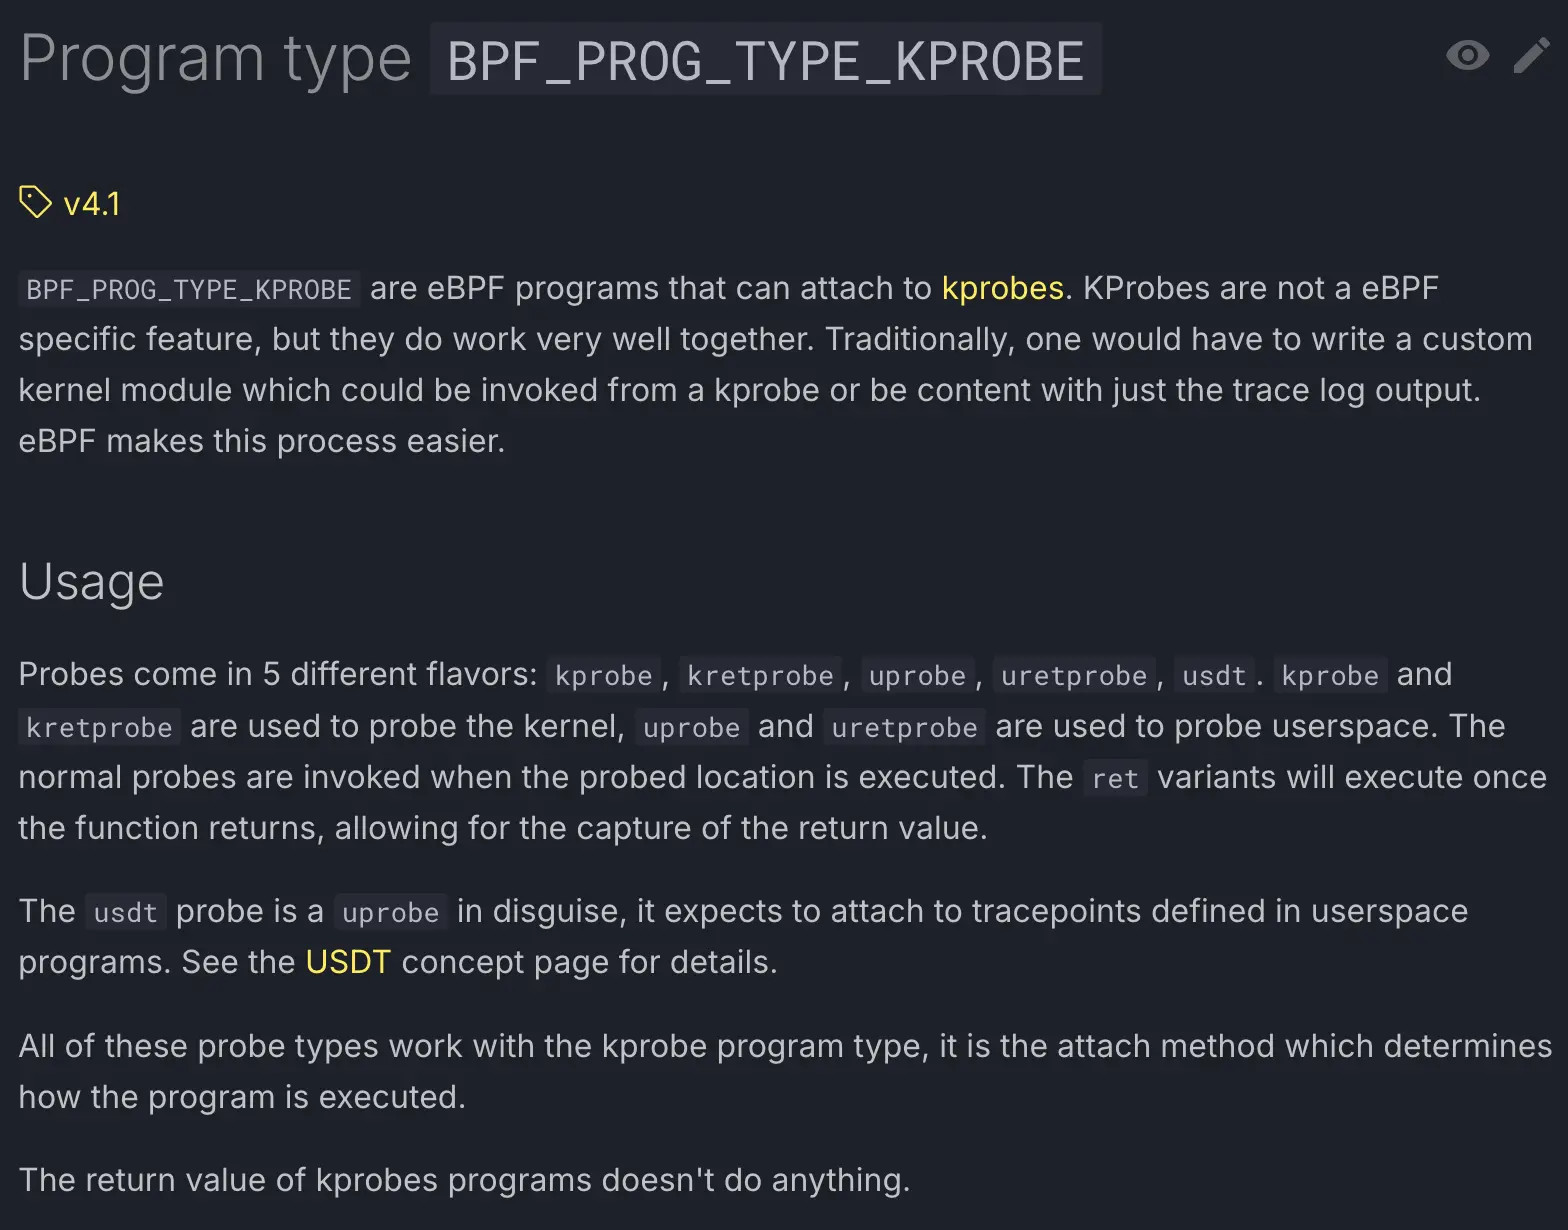
The purpose of kProbe is to observe Linux kernel functions. It can be considered the parent probe. All other probes are in fact the same type of program BPF_PROG_TYPE_KPROBE, but it is just the attachment point that determines how the program is executed.
kRetProbe: feedback on the kernel probe#
The kRetProbe is simply dedicated to observing the return of Linux kernel functions. This probe allows you to check whether the function call has completed successfully.
We have briefly looked at kProbe and kRetProbe, which could be the subject of other articles. Let’s now talk about the probes that interest us today: uProbe and uRetProbe.
uProbe: the probe for users#
Unlike kProbes, which are dedicated to observing Linux kernel functions, uProbes are dedicated to user space functions: User-space Probes. For example, they could be used to count the number of calls to the malloc and free functions in a C program.
uProbe also allows you to retrieve the content of the arguments of the observed function. This means you could look at the amount of memory allocated to each malloc or check that free is actually freeing the right pointers.
uProbes could therefore be integrated into a CI to automate security checks, facilitate debugging, or assist with memory diagnostics.
uRetProbe: user probe return#
Like kRetProbe, uRetProbe is designed to study the return of the target function in user space: User-space Return Probe. This allows us to discover the value returned by the function. This makes it possible to debug or observe the final behavior of the function.
But there is another benefit: by combining the times from uProbe and uRetProbe, we can easily retrieve the time it takes for a function to execute. This makes it possible to profile a function in your program.
uRetProbes and uProbes can be used to debug and understand a program for which you do not have the source code. This can be a useful reverse engineering tool.
However, they are limited to programs written in compiled languages: C/C++, Rust, Go, etc. If you have a program developed in another language, USDT might be a good fit for you. Let’s talk about it.
USDT: the user space tracepoint#
USDT stands for User Statically-Defined Tracing. As its name suggests, it is also dedicated to user space programs, but usdt probes must be added to the code in order to use them. USDT is, in fact, derived from uProbe.
However, it is much more accurate than uProbe. The uProbe is confined to the beginning of the function, while the usdt probe can be placed anywhere in the code.
Here is an example of Python code:
def benchmark_module():
    loop = 0
    for _ in range(100000):
        pyusdt.trace_start_loop(loop)
        calculate_pi(1000)
        pyusdt.trace_stop_loop(loop)
        loop += 1
With this code, we can get the time it takes to calculate the first 1000 decimal places of π.
We will now focus on uProbes and uRetProbes for the rest of this article. Let’s first talk a little about their history.
Origin story#
uTrace, the predecessor#
The desire to trace user space functions from the Linux kernel did not begin with the introduction of eBPF. For example, a (first?) attempt appeared in 2007 with uTraces:
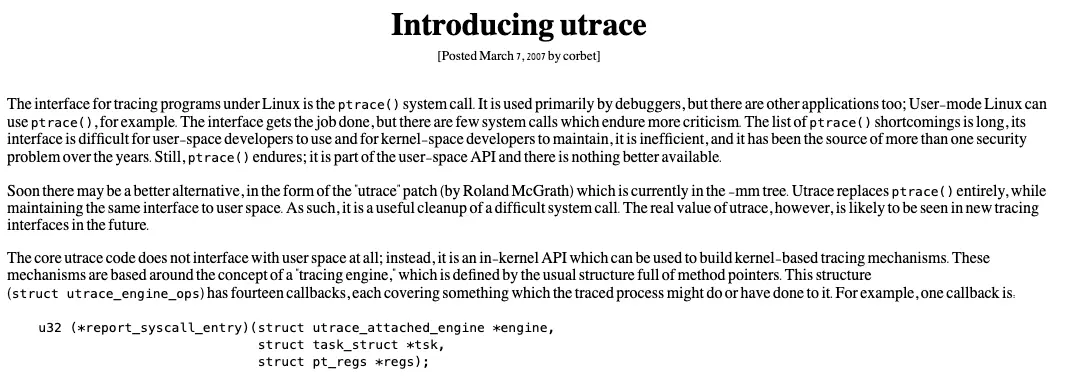
However, they were never included in the main code due to opposition from certain maintainers.
Habemus uProbe#
It wasn’t until 2012 that consensus was finally reached, and uProbes were introduced in version 3.5 of the Linux kernel:
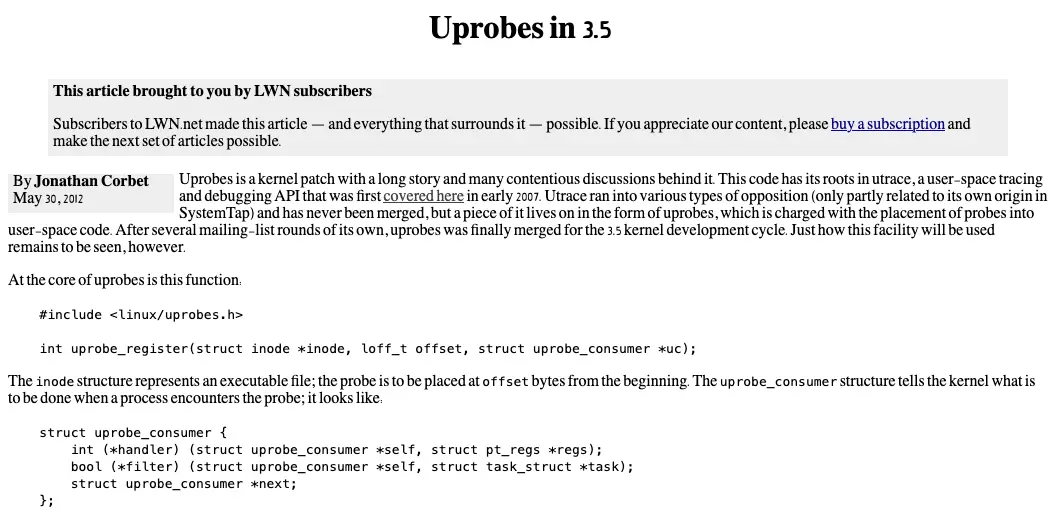
At the time, uProbes were limited compared to what we know today.
They were then improved with version 3.14 (released in 2014, the same year that eBPF was introduced):
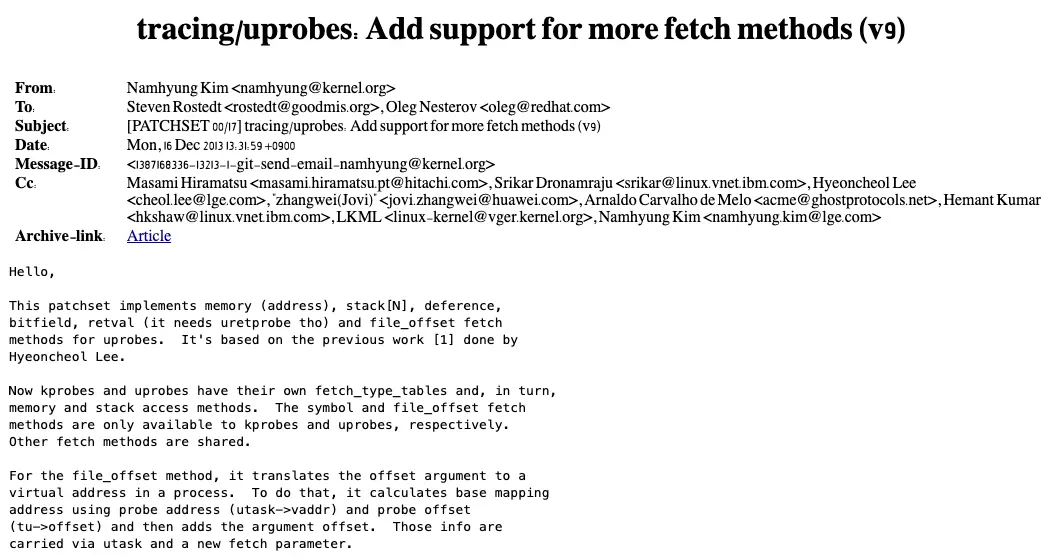
This patch made it possible to retrieve a greater amount of data, such as the return value of a function.
uProbes then became fully usable even though eBPF had not yet been released. Let’s see when it was integrated.
uProbe with eBPF#
In the kProbe eBPF documentation, kProbe appeared in 2015 in version 4.1. Alexei Starovoitov, one of eBPF’s creators, was the one who initiated it:
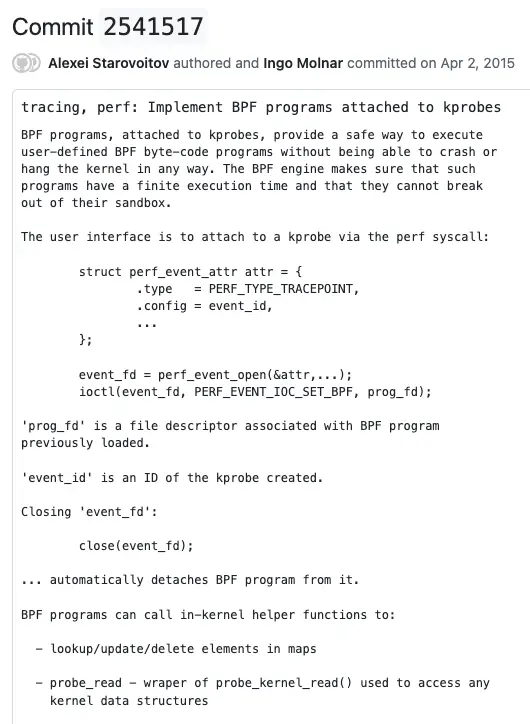
Since a uProbe is a kProbe with a different attachment point, we were able to start developing uProbes with eBPF as of April 2, 2015.
However, we still had to wait for the eBPF frameworks of the time to be able to handle it.
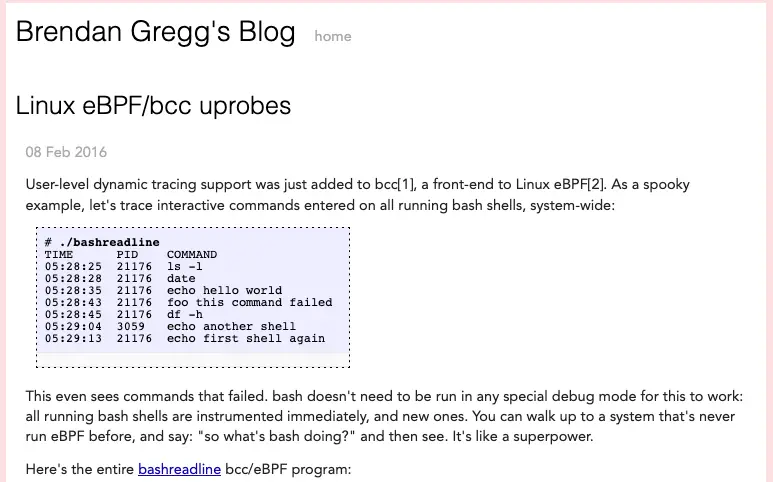
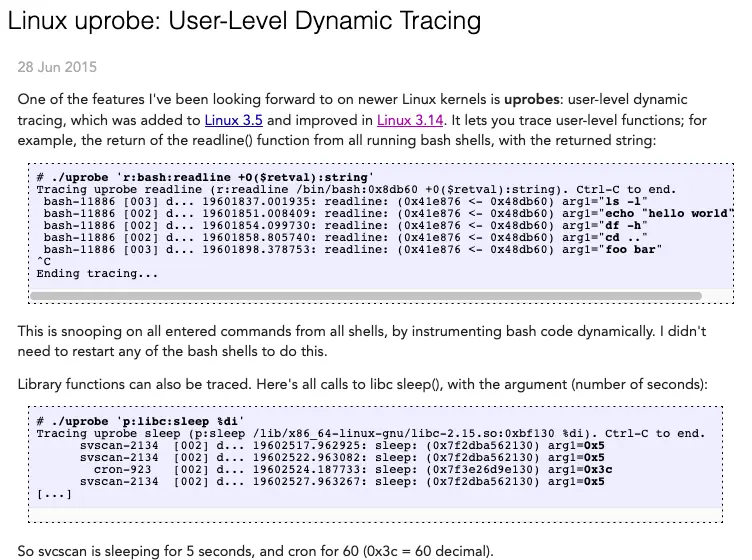
So we could already use it in 2016 with BCC as evidenced by Brendan Gregg’s tutorial:
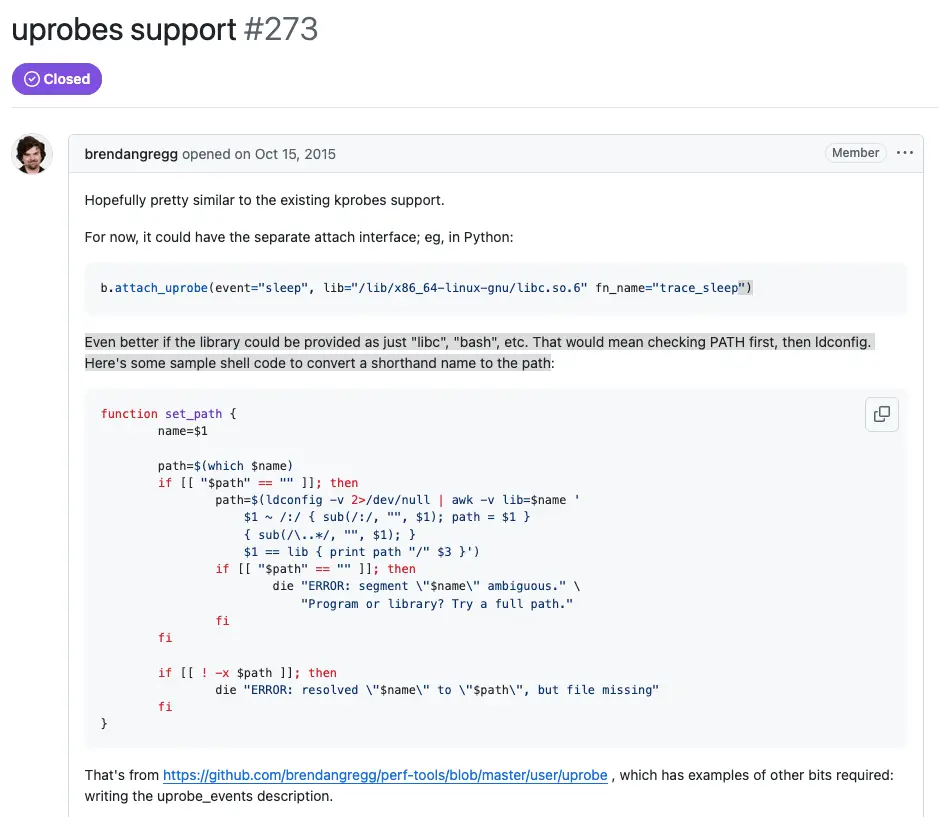
You can also see his GitHub issue from October 2015:
Finally, here is a brief timeline of the history of uProbes:

Now that uProbe has been around for over 10 years, it’s fair to ask: is it still being used, and if so, by which projects?
Which projects use u•Ret•Probe?#
To challenge the common misconception that “eBPF is only used by three big companies”, I did a little research on tools that actually use uProbes, which means you may be using them without even knowing it…
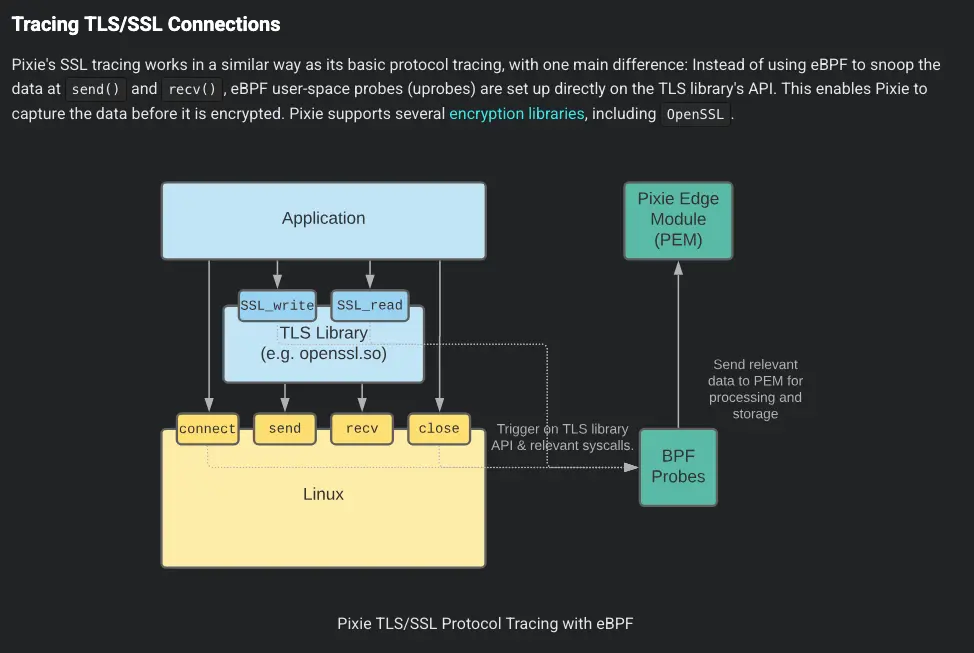
Pixie: Where is my mind?#
The Pixie project uses uProbe in particular to trace TLS connections:
There is also an article by Douglas Mendez on capturing HTTPs traffic with Aya.
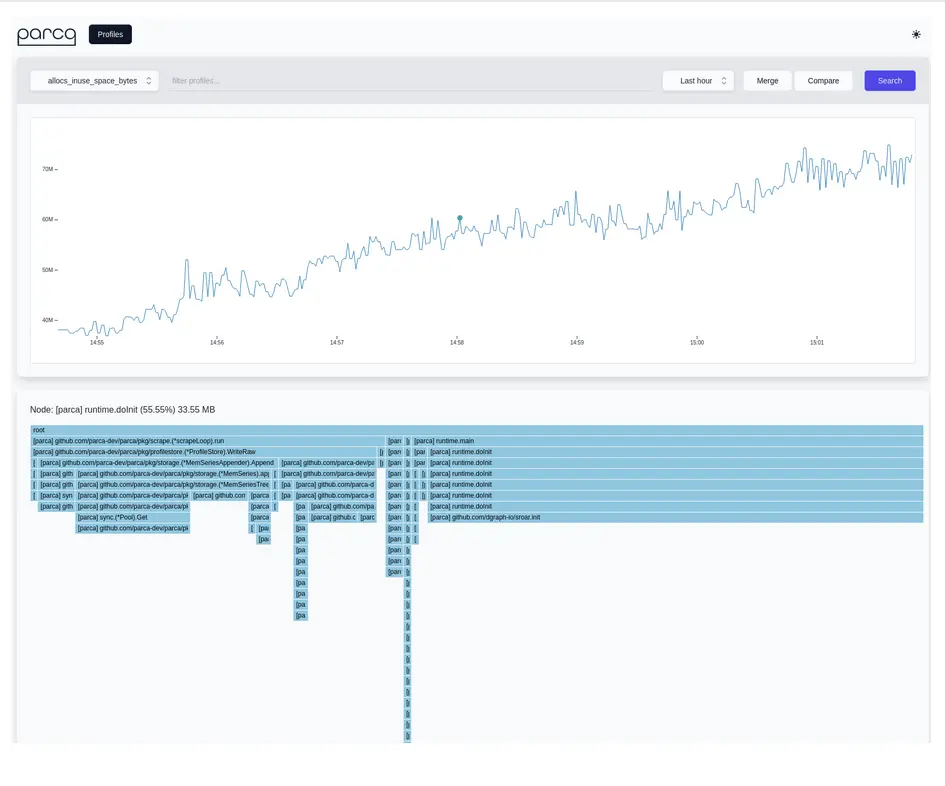
Parca: Winter is coming!#
The Parca project also uses uProbes.
Inspektor Gadget: I’m always on duty!#
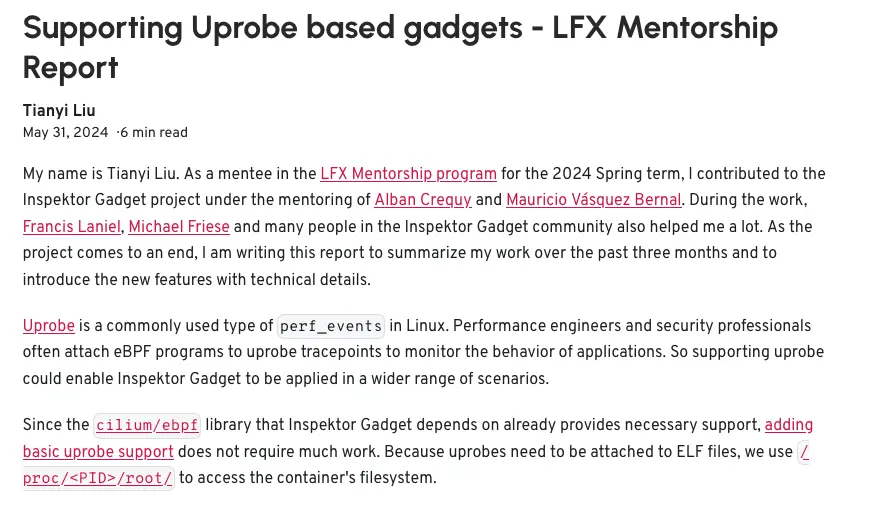
The Inspektor Gadget project has been creating tools based on uProbes and USDT probes since 2024:
Bonus Track#
To conclude this presentation, I would like to share some interesting links that I found while researching uProbes:
- Using uProbes without eBPF by Brendan Gregg in 2015:
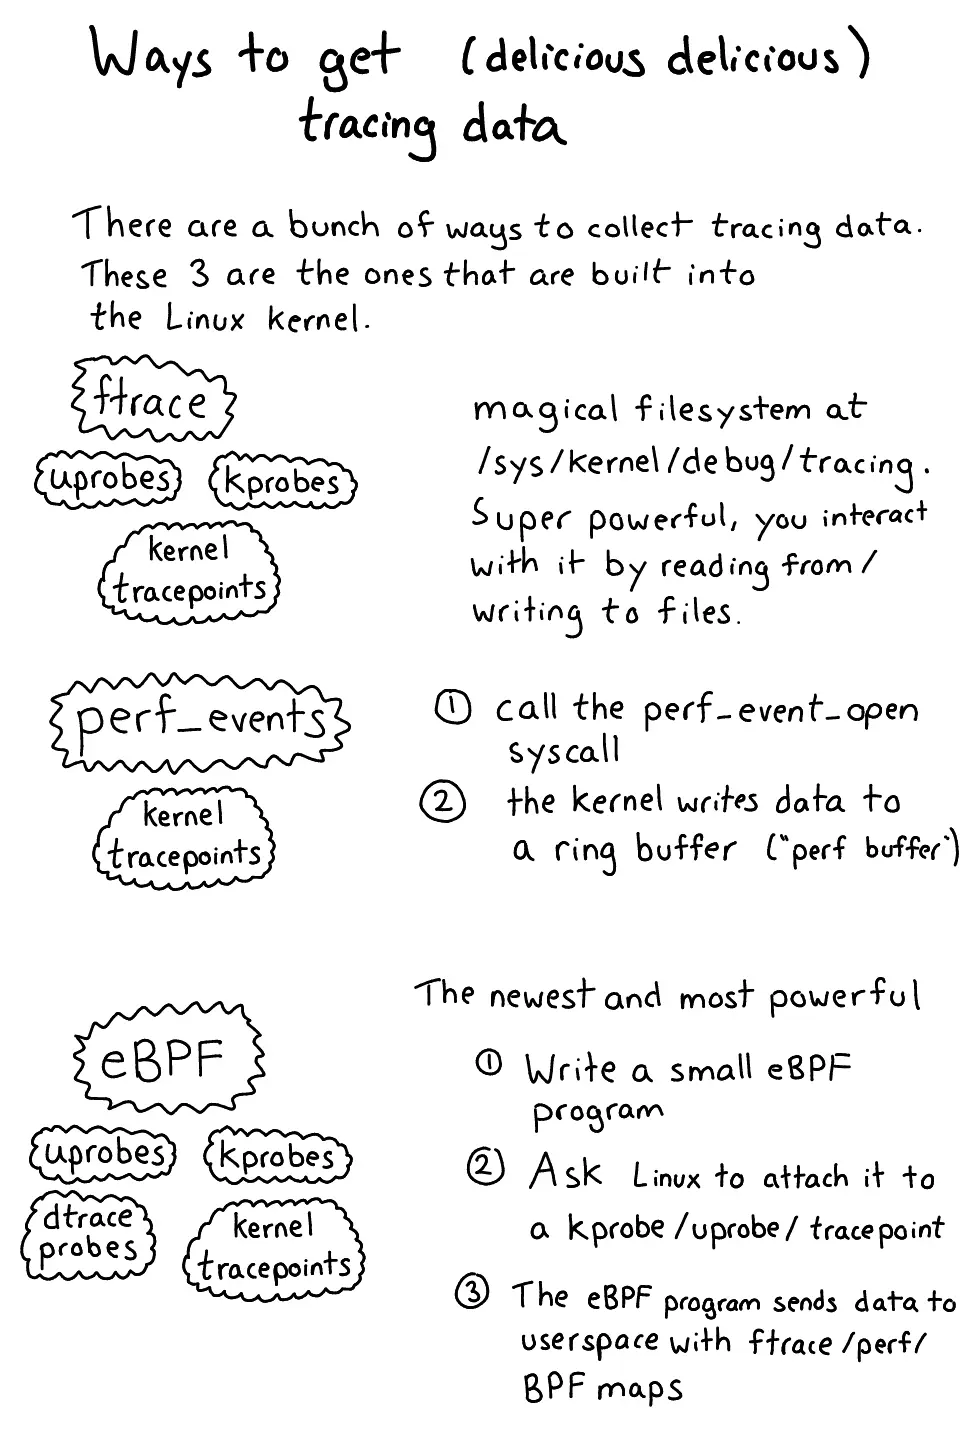
- Julia Evans’ excellent blog post on all tracing systems on Linux. You can also read her zine:
- If uProbes aren’t right for you, you might be interested in Eunomia’s bpftimes:
Now that we’ve introduced uProbe and uRetProbe, let’s see how to get started with development using Aya.
How to start your Aya program?#
When you start developing a new eBPF program, the first challenge is getting it to start. To do this, it needs an event-driven trigger. In this episode, this event will be the passage of a uProbe or uRetProbe in the Linux kernel.
Aya makes this task easier. When you run the command:
cargo generate https://github.com/aya-rs/aya-template
You will need to answer two important questions that will help define this event:
🤷   Target to attach the (u|uret)probe? (e.g libc):
🤷   Function name to attach the (u|uret)probe? (e.g getaddrinfo):
Let’s see how to answer them.
Target for attaching the u•Ret•Probe#
The first question asks for the name of a library (such as libc) or a binary. The question could have been phrased differently: which file do you want to debug or trace?
Think of it as a filter:
- If you choose
libc, the eBPF program will only start if a program fromlibcis running. - If you choose a binary, it will only start if the binary is running.
But this is not enough to start the eBPF program. You need to be more specific: give the name of a function.
Name of the function to attach the u•Ret•Probe#
The second question asks for the function of the binary or library you want to debug.
For example:
- If you choose the name of a function from a C program, the eBPF program will be launched each time it passes through this function.
- If you choose a function from
libc, it will only be launched when a program calls this function fromlibc.
If this seems a little too theoretical, we will finish the chapter by talking about a very useful tool that will allow us to illustrate this.
Getting started with eBPF using bpftrace#
The bpftrace project allows you to quickly create most types of eBPF programs dedicated to tracing, including uProbe and uRetProbe, as well as USDT, kProbe, and kRetProbe (see support here).
Feel free to install it; it is probably packaged for your favorite Linux distribution.
Enough talk, let’s look at an example:
sudo bpftrace -e \
'uretprobe:/bin/bash:readline { printf("%s\n", str(retval)); }'
What does this mean?
uretprobe: the type of eBPF program/bin/bash: the target binaryreadline: the name of the function{ printf("%s\n", str(retval)); }: the bpftrace program code (it displays the return value of the function)
This command creates an eBPF program of type uRetProbe with the readline function of the bash binary as its attachment point.
If you have actually run the command, you will see that this creation is almost immediate! Let’s check that it works properly.
Start another terminal and run a few commands of your choice. Here is an example of what you will see on the bpftrace terminal:
Attaching 1 probe...
ls -lrth
hello
man woman
You can see all the commands you typed on the terminal!
bpftrace can therefore be a good way to prototype a uProbe or uRetProbe program before generating it with Aya.
What if I want to observe a function other than readline in the bash program? How do I do that? The first instinct would be to go into the bash code and look for another function, but there is an easier and safer way:
bpftrace -l 'uretprobe:/bin/bash:*'
This command will list all the functions available in bash.
bpftrace -l 'uretprobe:/bin/bash:*' | wc -lBpftrace will allow us to verify feasibility before creating the program in Rust with Aya.
In this episode, we looked at the basics of uProbes and uRetProbes: what they are used for, their history, who uses them, and how to find the right hook. We also looked at bpftrace, a tool that allows you to create probes quickly.
Now let’s move on to the practical stuff. In the next episode, we’ll create a small Go program and make it interact with uProbe and uRetProbe eBPF programs using Aya.